Weather Reports
Weather Reports
2021
Mixed media on paper
Video (1:06) - Watch on Vimeo.
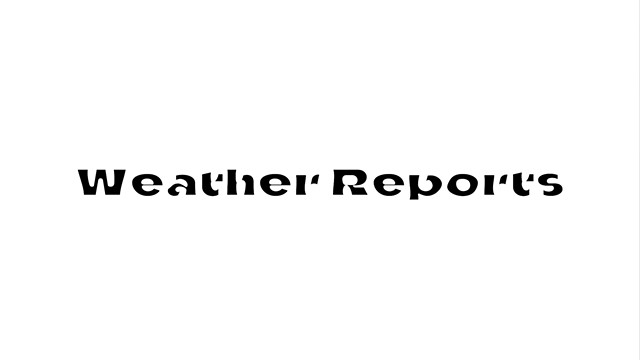
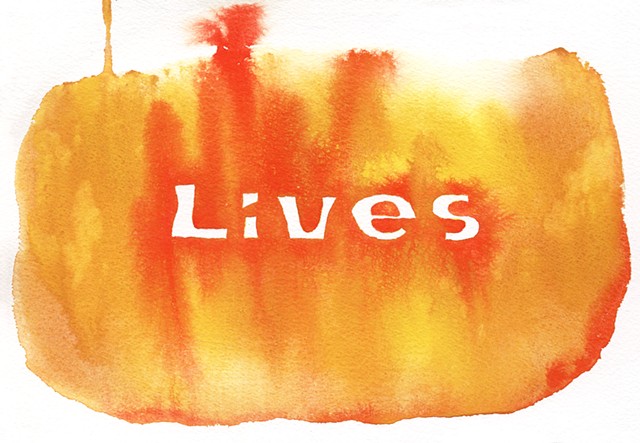
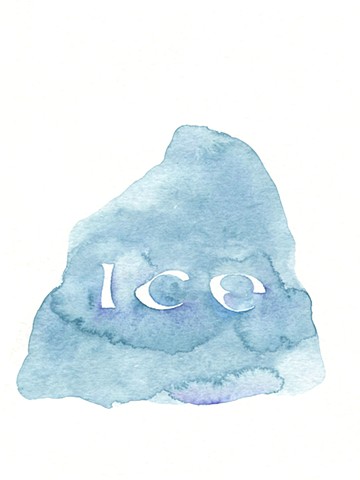
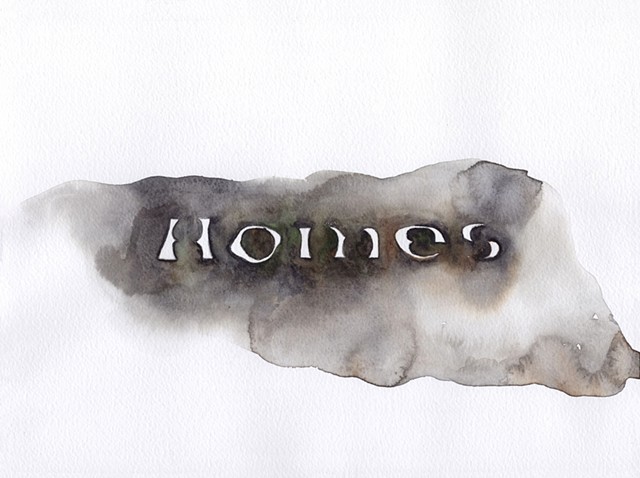
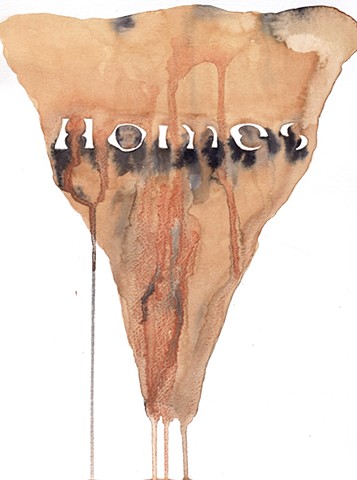
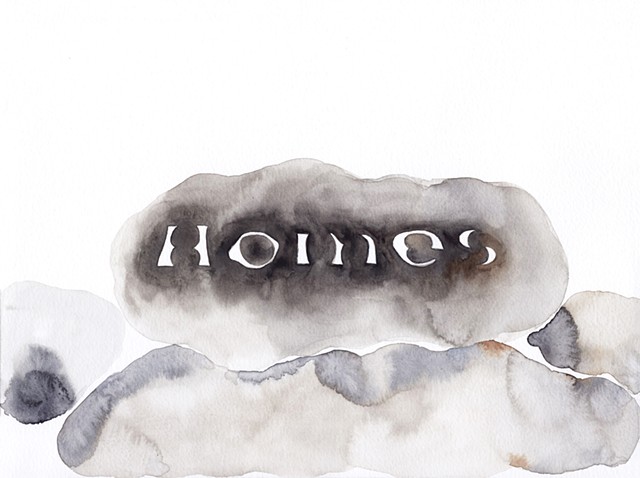
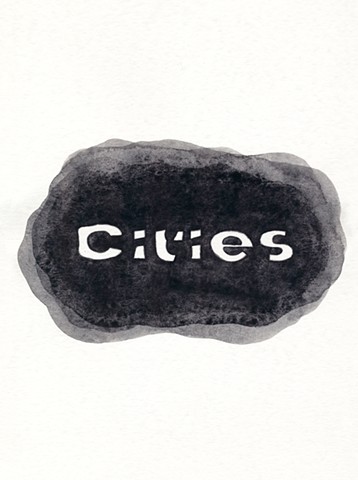
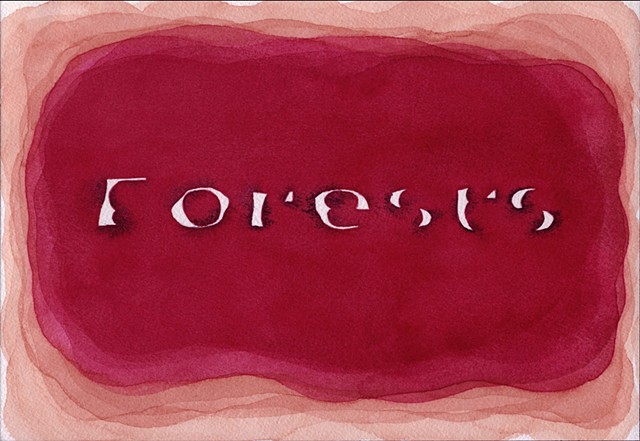
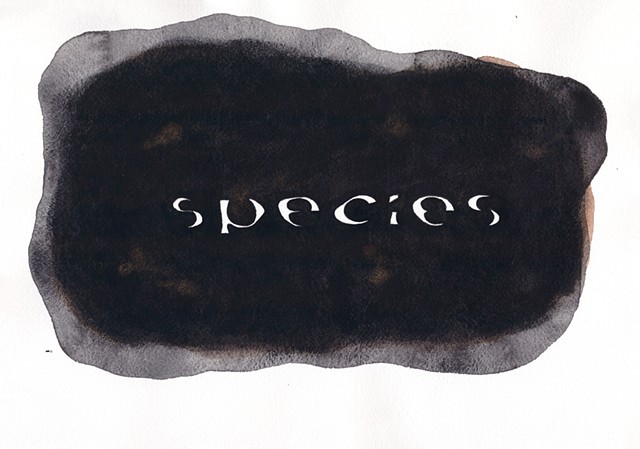
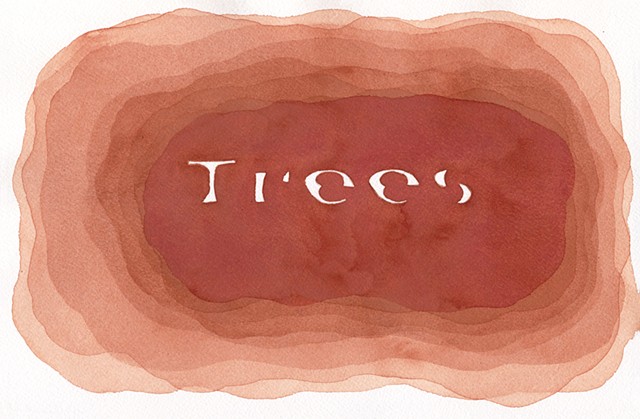
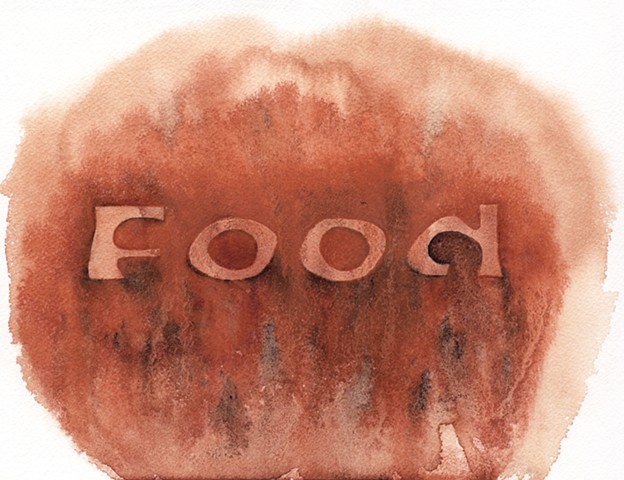
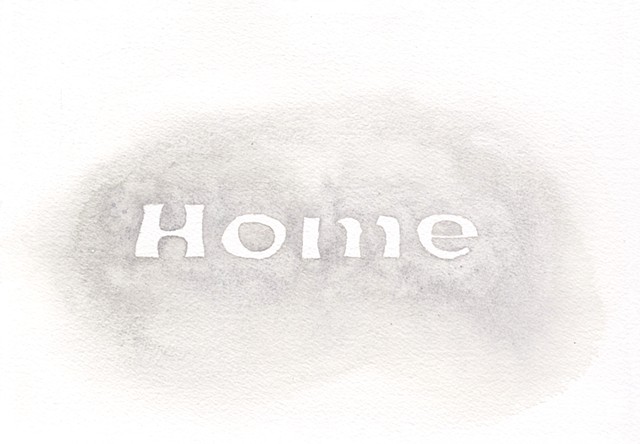
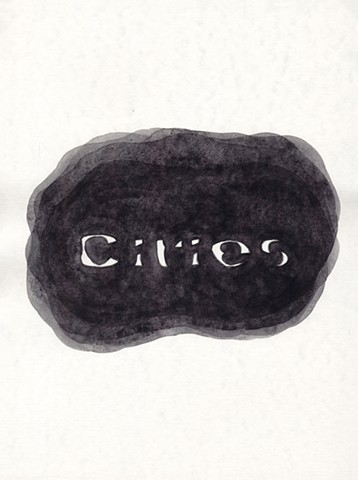
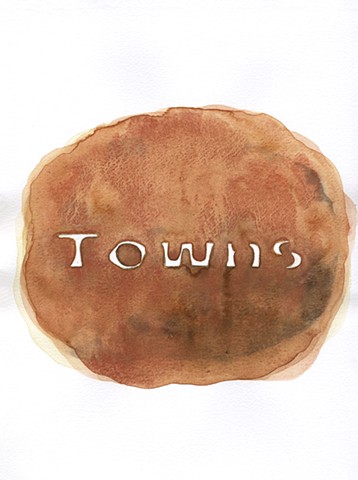
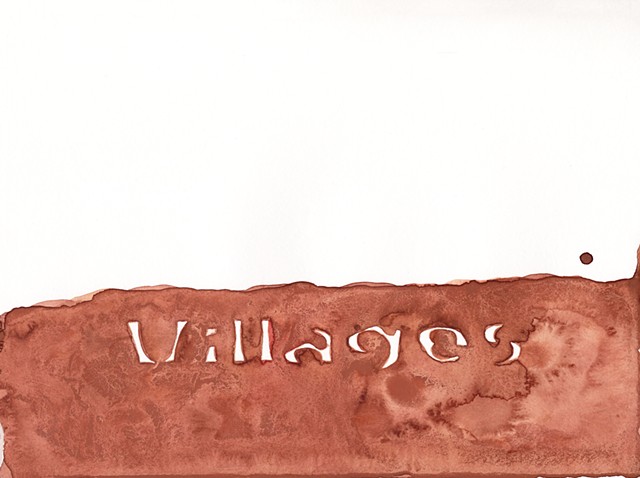
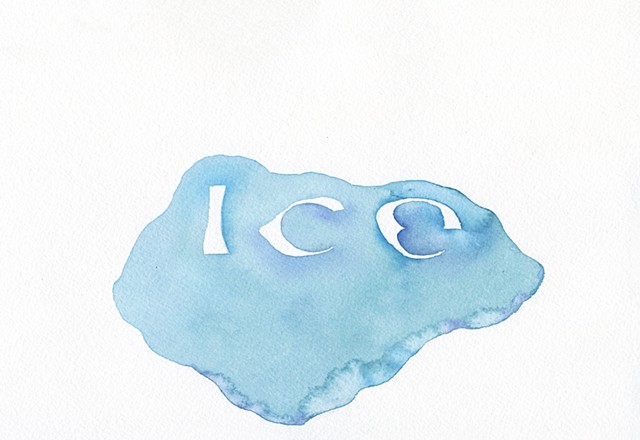
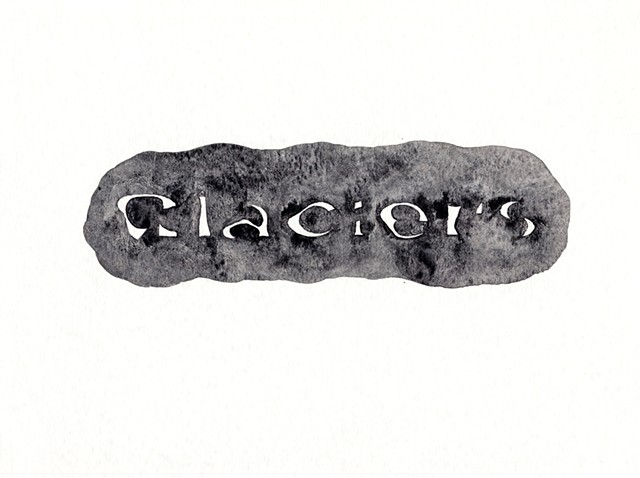
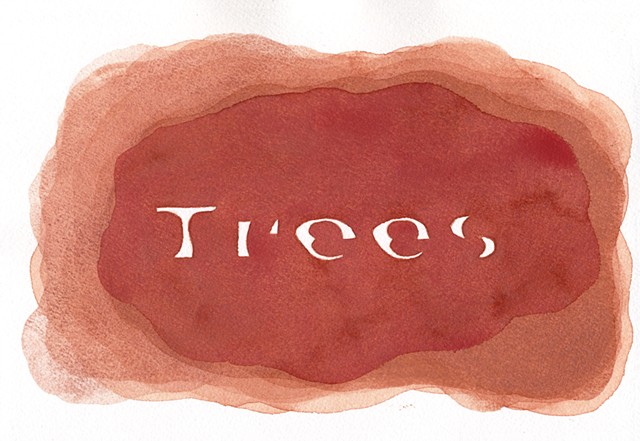
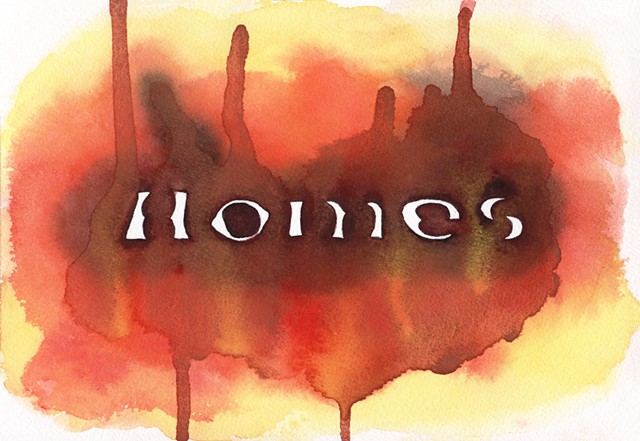
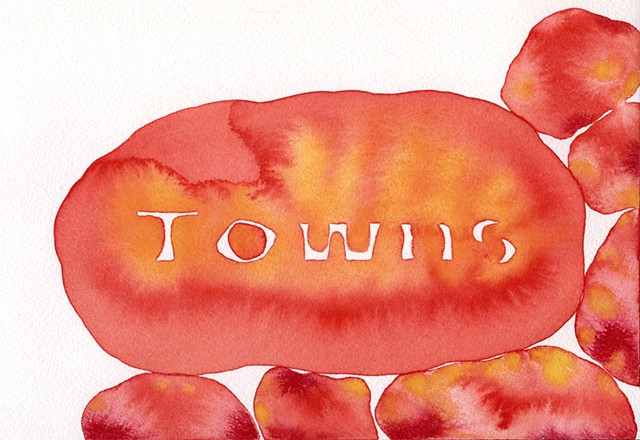
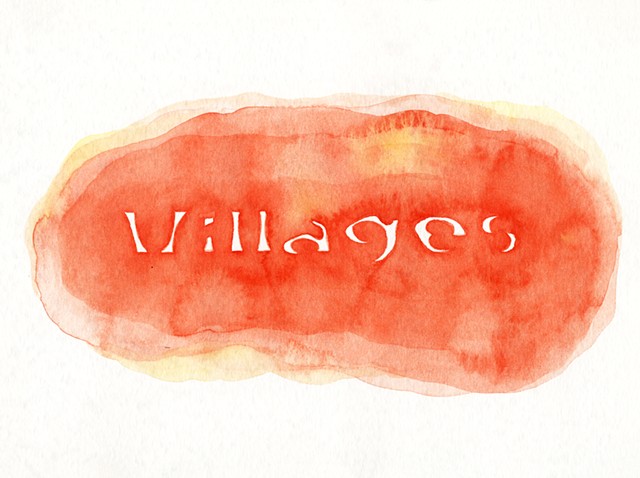
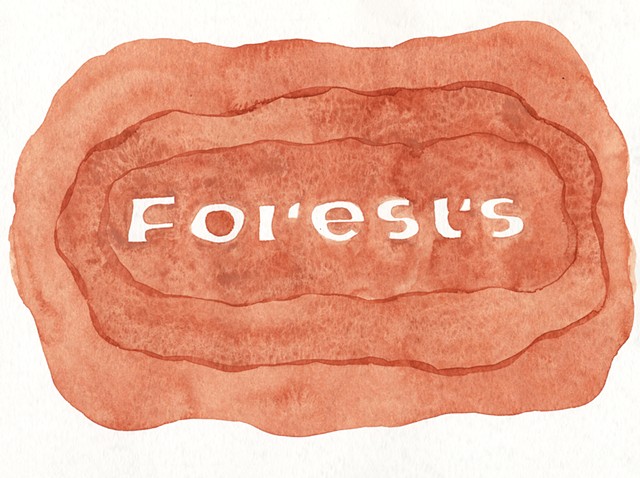
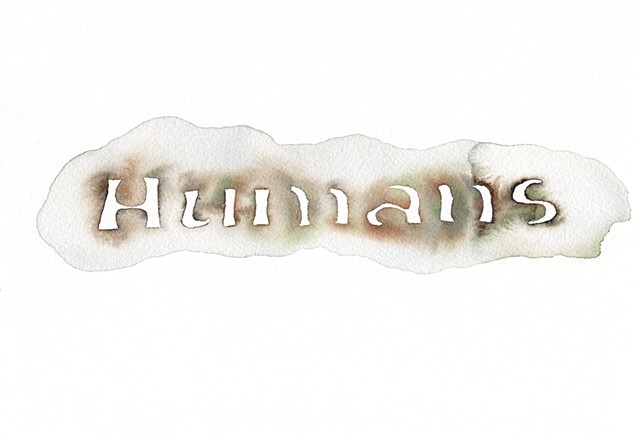
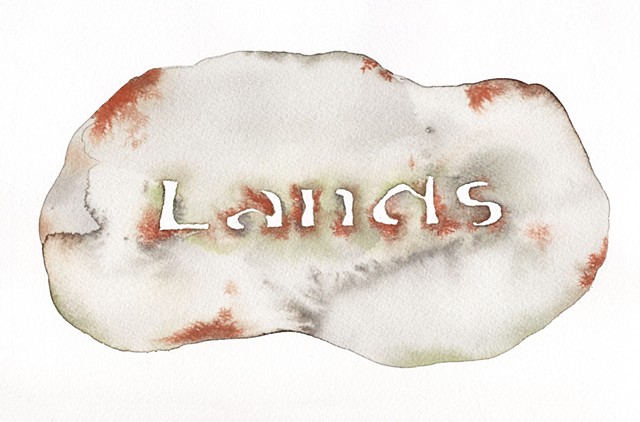
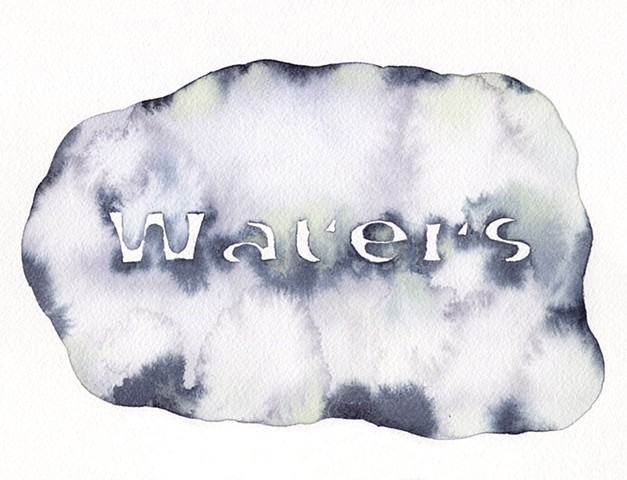
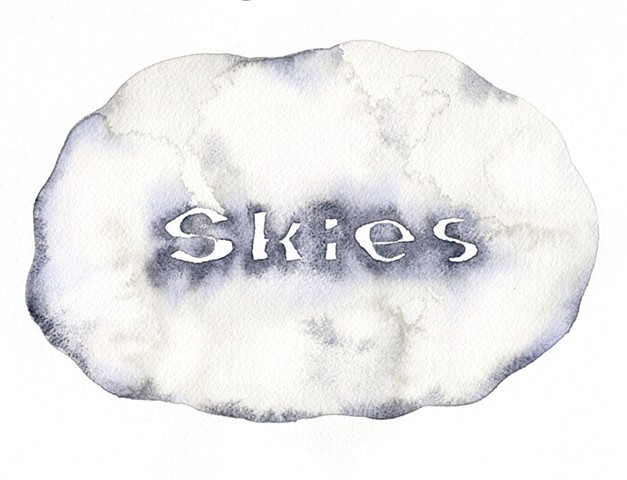
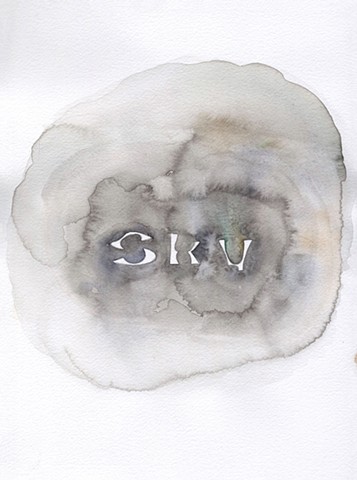
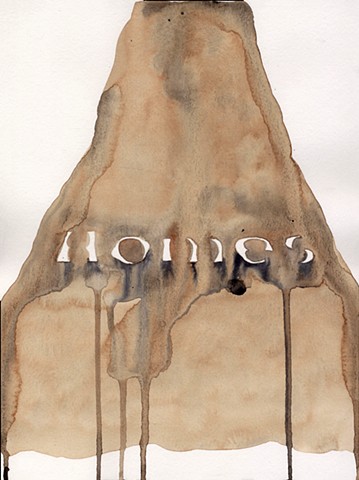
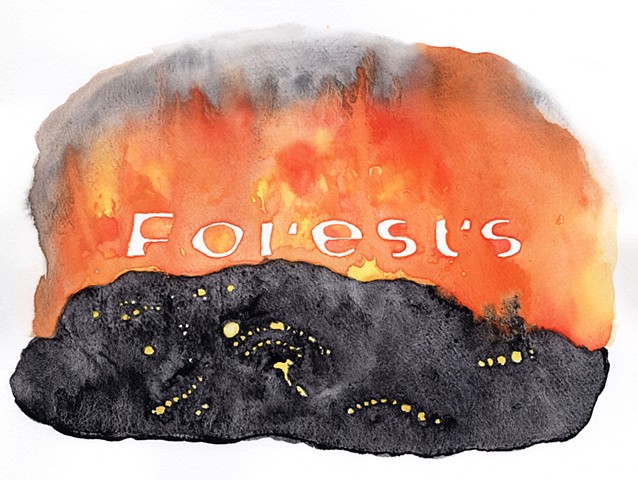
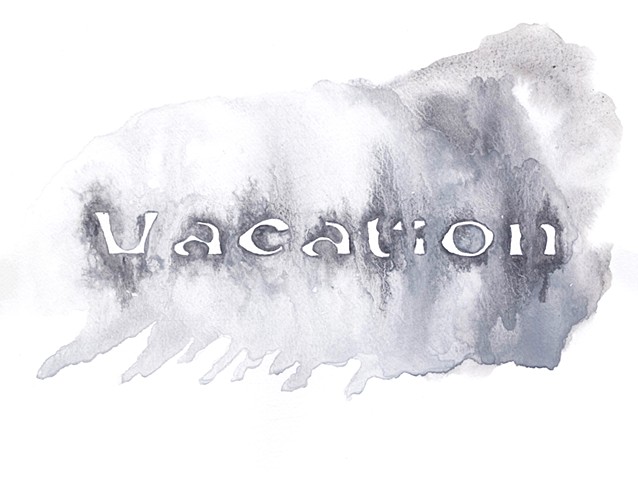
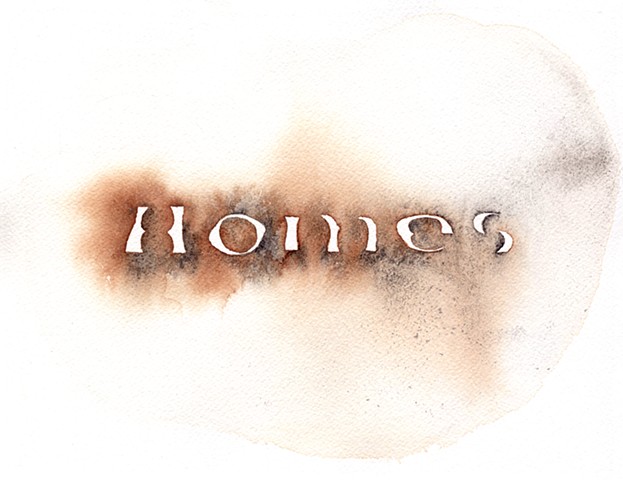
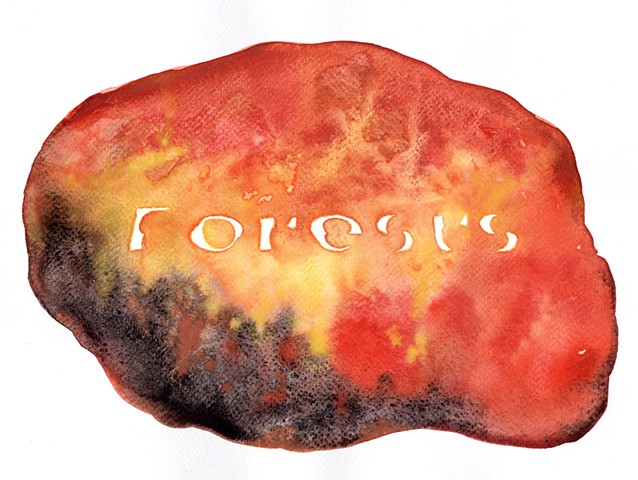
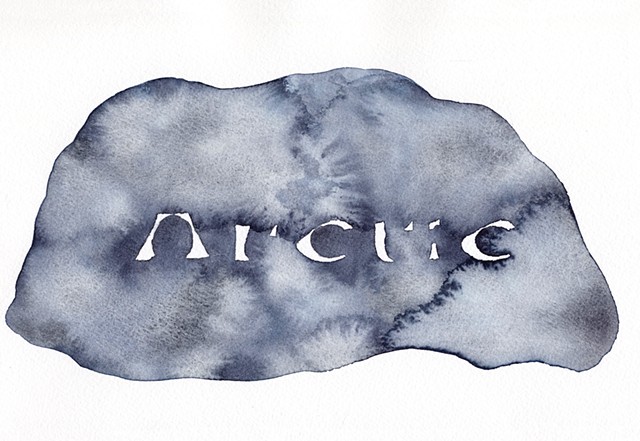
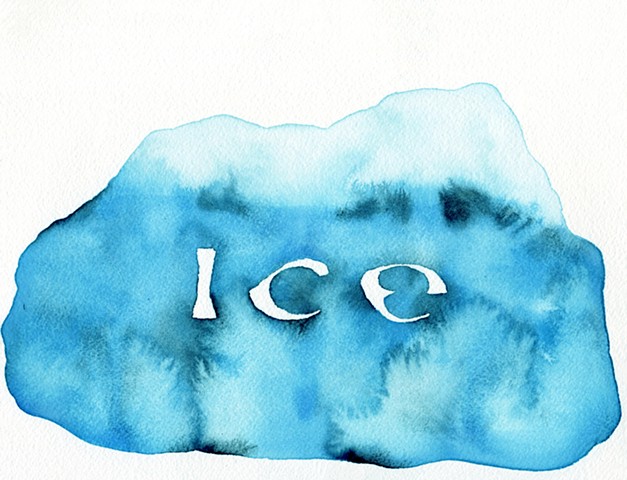
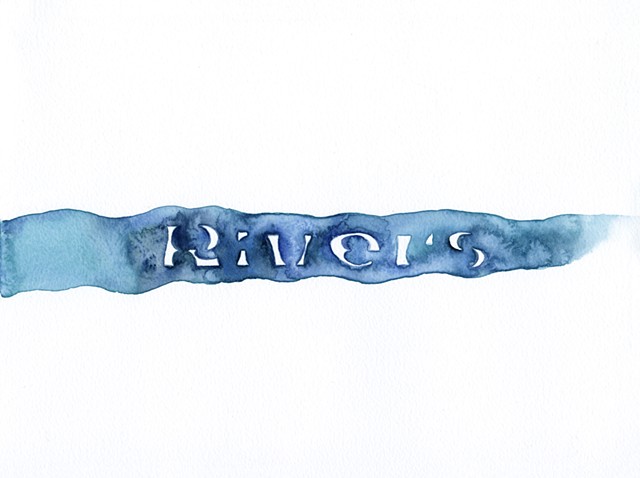
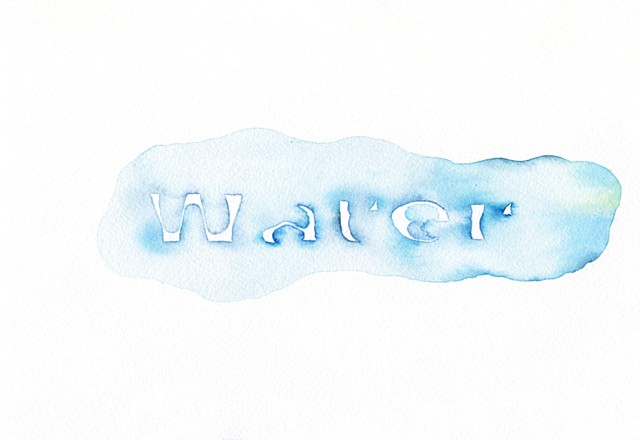
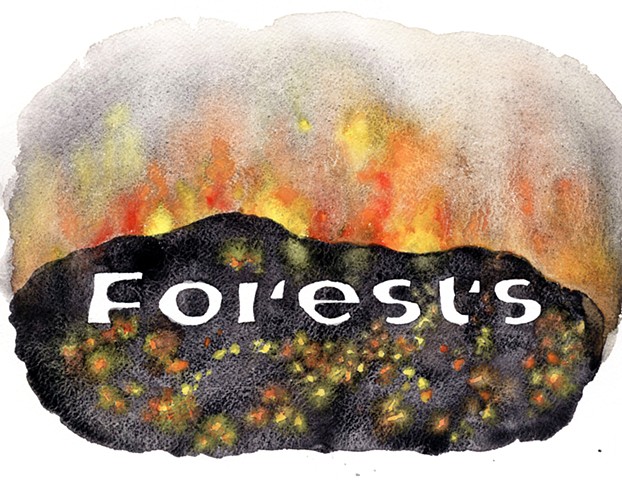
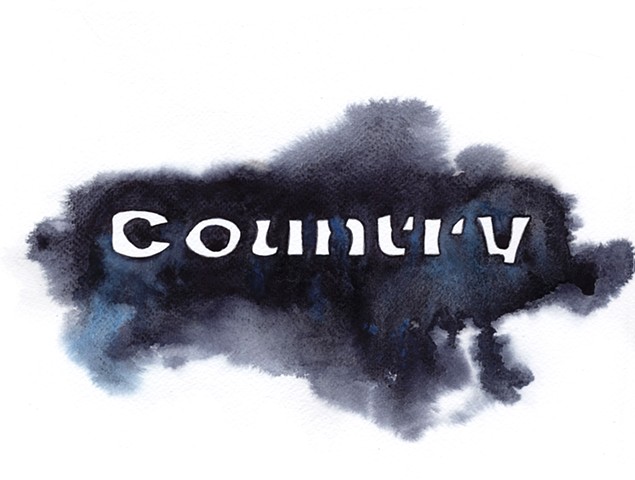
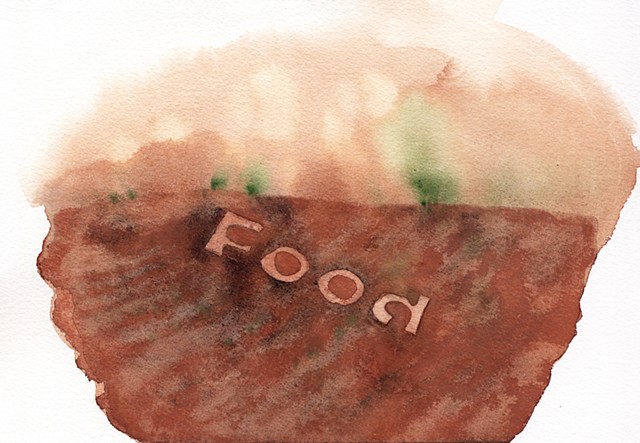
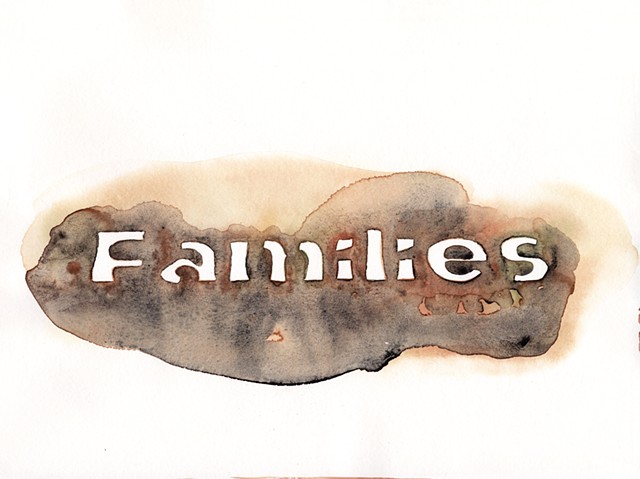
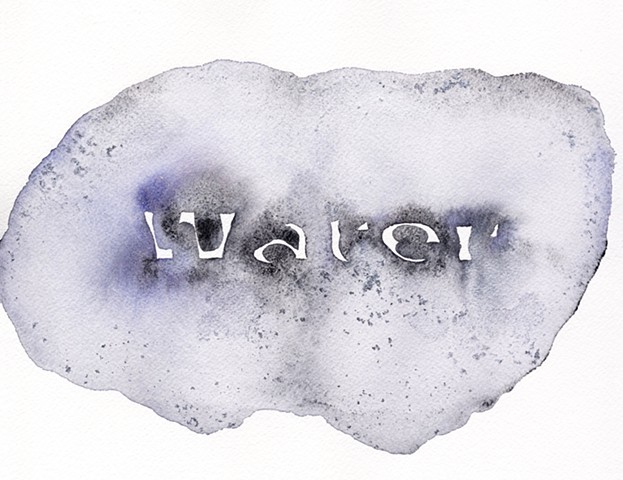
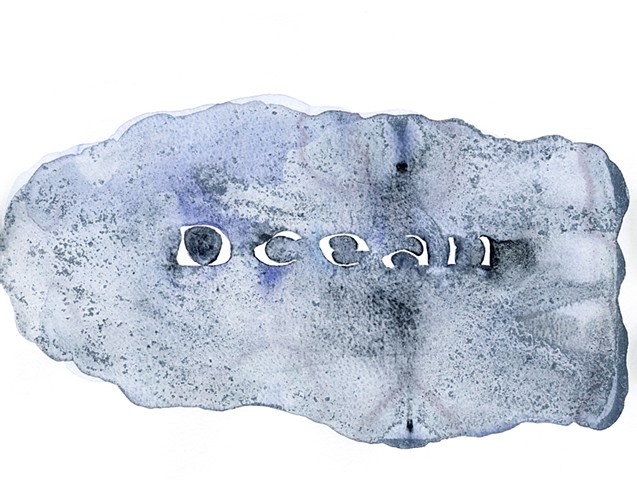
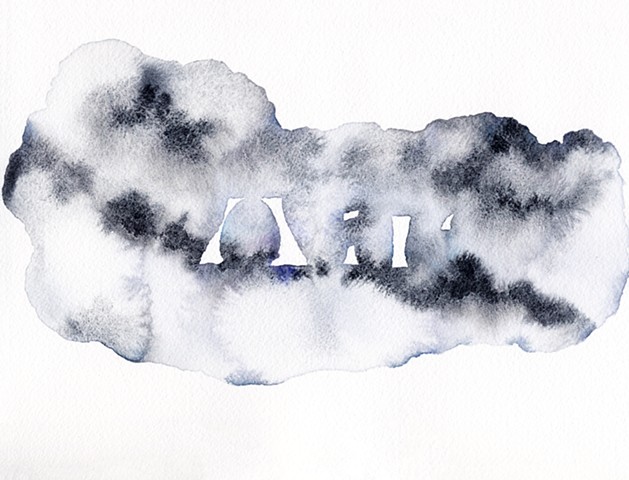
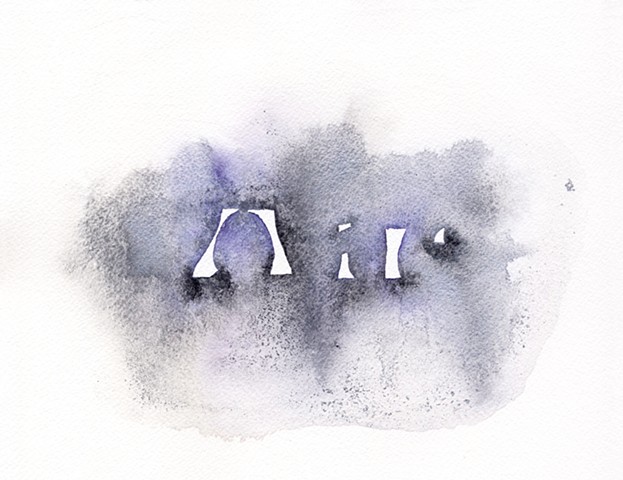
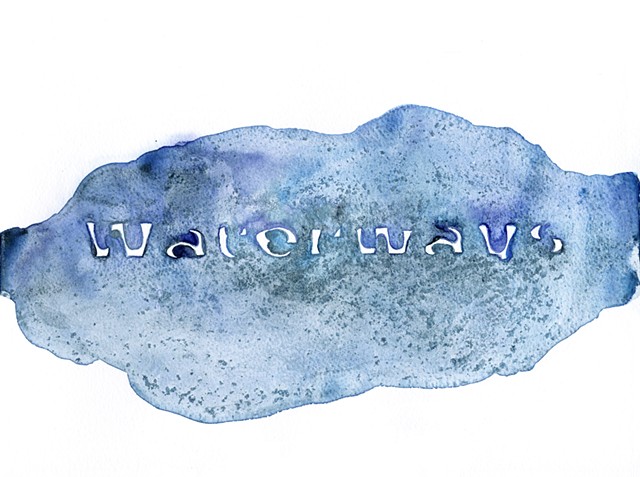
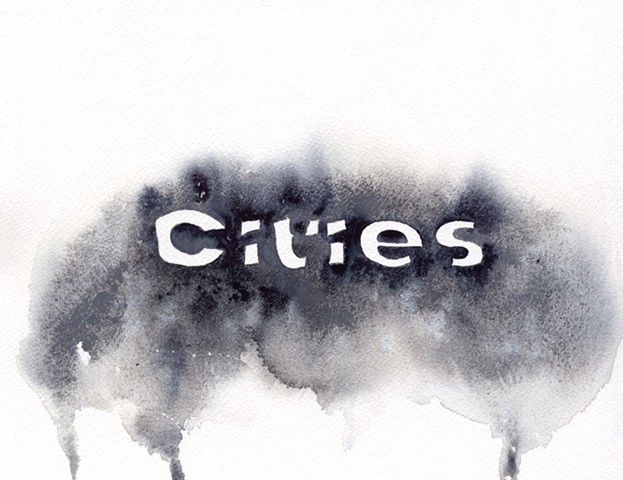
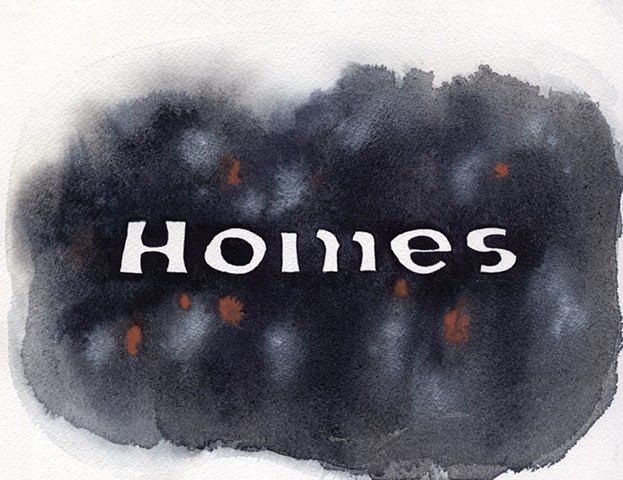
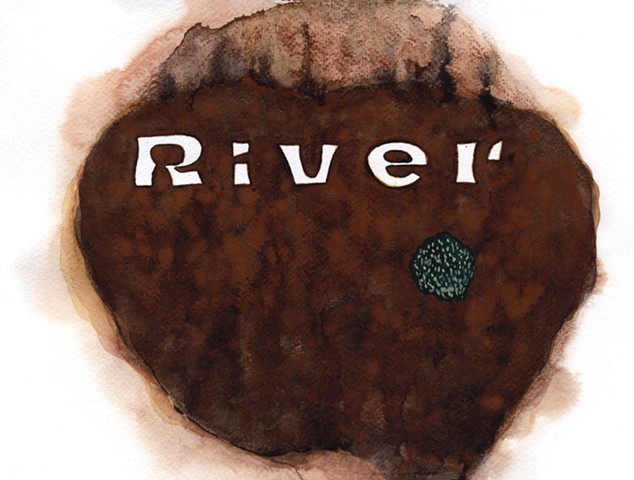
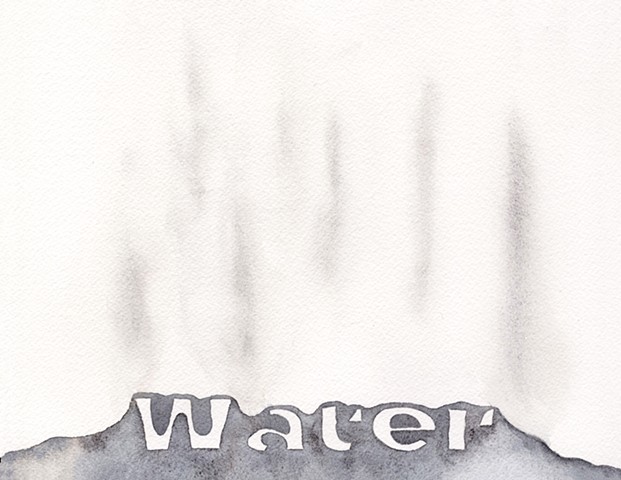
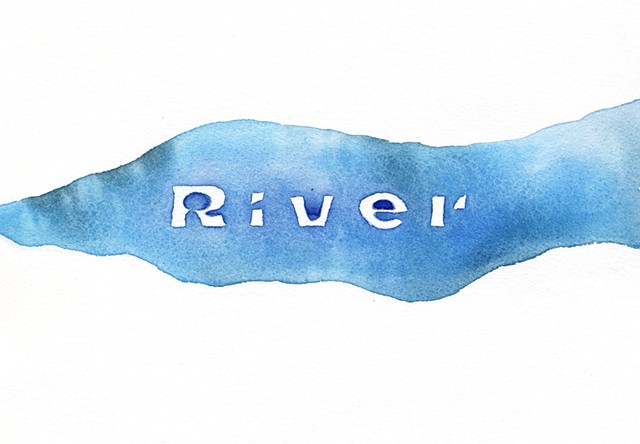
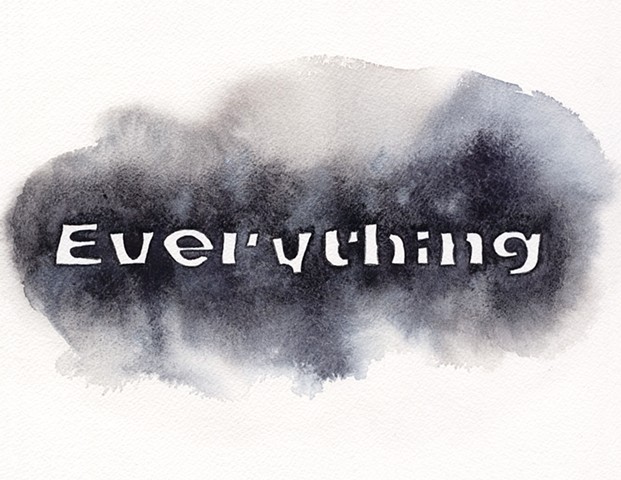
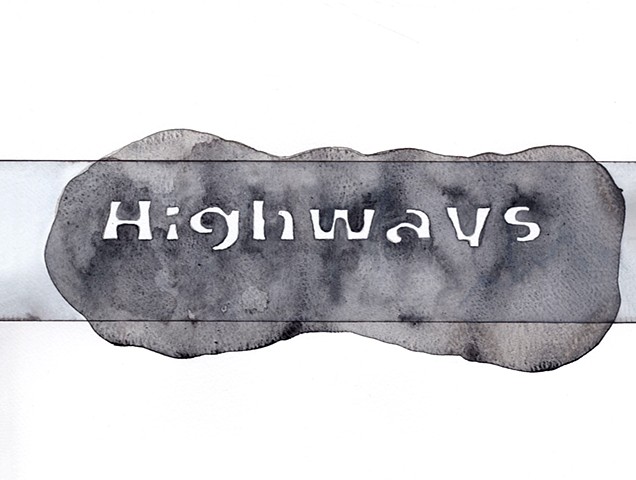
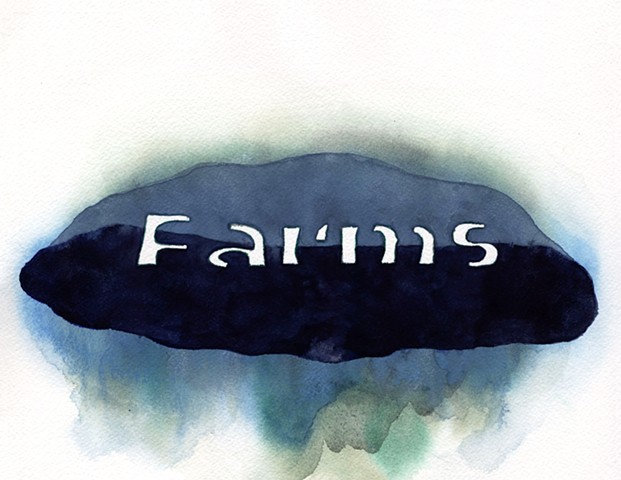
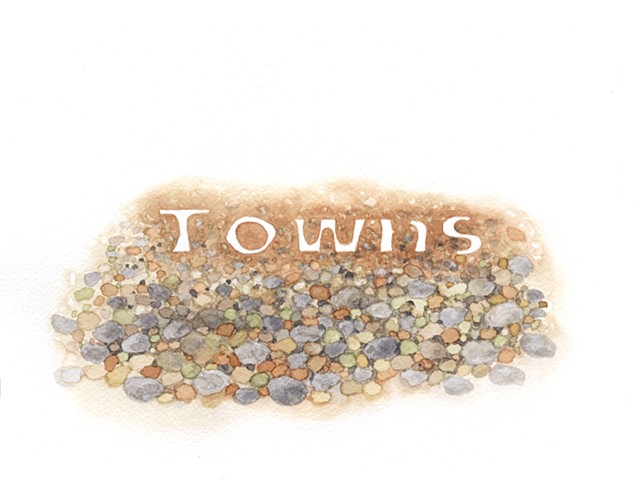

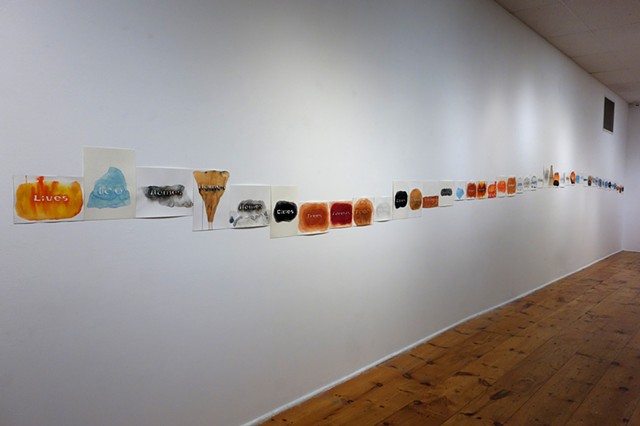
In the summer of 2021, I started making drawings of a word that spoke profound loss caused by extreme weather events. My first entry was on June 30, 2021 with Lytton wildfire in British Columbia, Canada. Prior to June 30, the village of Lytton reached the temperature of 49.6 °C (121.3 °F), the highest temperature ever recorded in Canada.
Then came July 1 with Arctic ocean warming about two and a half times faster than average, much faster than other regions. July 3 and 4, severe floods and mudslides in southern Japan; July 15, raging floods in western Europe; July 17, wildfires in Siberia; July 19, the Bootleg fire in southern Oregon; July 20, Madagascar's famine which was the first in modern history to be solely caused by global warming. The headline in TIME read “Heatwaves, wildfires, floods. If there’s still any doubt that the summer of 2021 is a turning point for a global awakening over the looming climate crisis, you can add one more plague of biblical proportions to the list: famine.”
It kept going on and on like that. July 25 with the record breaking flooding in China; July 26 with landslides and floods in India; July 30, the amount of ice loss in Greenland on July 27 alone could cover Florida in 2 inches of water. August saw more wildfires in Turkey, Greece, Europe, and California, and hurricane Ida in Louisianna, smoke from wildfires reaching the North Pole for the first time, and the Paraná River in South America was drying up. I kept making my drawings, not knowing what else to do.
I used the Climate Crisis Font, which was developed by the Nordic’s largest newspaper Helsinging Sanomat. The font’s weight responds to NSIDC’s (National Snow and Ice Data Center) Arctic sea ice data from 1979 to 2019 and Intergovernmental Panel on Climate Change (IPCC)’s prediction all the way to 2050. One can visually get a sense on how much the ice has been melting and how much it is expected to melt in the future based on current forecasts.
I used the font with the future prediction, mostly for 2050.
My last entry for this work was November 21, 2021 with the flood in Vancouver. After completing over fifty drawings, I made a short video using these drawings.
On the back of each drawing were the quotes from an article I was reference to, including the headlines, locations of the disasters, dates, names of the writers and news outlets. Edited quotes are included on this website.
In a way, one word is enough to feel urgency, I thought. And I thought the summer of 2021 was a turning point.
- Naoe Suzuki
Updated in August, 2026